Amira
Amira: ZIB’s Advanced 3D Visualization System
Amira is a research software package for the development of new advanced high-end visualization methods, developed by the visualization department of the Konrad-Zuse-Center for Information Techniques Berlin(ZIB).
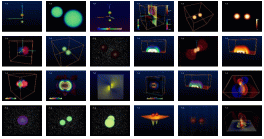
Amira can be used to view 3D data of scalar fields, vector fields, tensor fields, apparent horizon multipole expansions and gaussian curvature data, embedding coefficients, remotely computed isosurfaces (similarly to IsoView), geodesics, and more. For remote visualization a remote control interface for steering Cactus simulations is also available.
Obtaining Amira
Demo Version
A free time-limited, but renewable demo version is available for downloading from ZIB after registration. In addition you need the (free) Numerical Relativity extension for handling Cactus data.
Commercial Version
Amira is distributed commercially through Template Graphics Software. Please enquire at this site for a fully qualified version.
Special Arrangements for Cooperation Partners
Special arrangements can be established for partners contributing to the Amira development process. Cooperation partners may receive renewable free updates of the internal development version of Amira including the newest features and bugfixes.
Using Amira
Amira is designed for an end-user who has minimal experience with visualization tools, meaning that anything deemed untrivial is considered to be too complicated and should be treated as a bug.
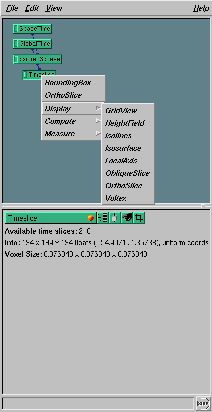
Amira provides a kind of visualization network, which graphically displays the current settings and relationships among the visualization components. In contrast to other tools like AVS or IBM DX, you don’t see a (possibly complicated) data flow diagram, instead the data is directly displayed as (green) icons and the appropriate displays pop up from right-mouse button clicks on the green icons.
Predefined Networks

While it is easy, with only a little experience, to construct simple visualization networks from scratch, a couple of `standard’ visualization networks which arise in every-day work with Cactus data are predefined. To get a list of all these (daily growing) list of networks, simply issue
amira2000 '+?'
on the command line. This will print a list of available networks and, for example, starting Amira with
amira2000 +remoteviz
will launch Amira ready for retrieving data from a remote simulation.

Working with 3D data
As an example of looking at some data set, for example 3D data in FlexIO format written by Cactus, simply invoke Amira with the appropriate filename, e.g.
amira2000 psi0re_3d.ieee
Note that large datasets beyond the 2GB limit are supported and can be handled, conveniently fast, with on-demand loading A green data icon will appear, named according to the file name. From that, use the right-mouse button to select a `timeslice’ data set, for which a number of visualization modules can be applied.
Support
Amira is used by the following projects (as part of a ZIB-AEI cooperation):
ART Project - Visualization of General Relativity
AMR Project - Visualization of Hierarchical Datasets
TIKSL Project - Remote Visualization
GriKSL Project - Remote Visualization
Please write to the individual peoples associated with these projects with specific questions, or write to amira@zib.de for general inquiries.

