xGraph
xgraph: Animated, Easy Client for 1D Line Plots
xgraph is a freely available, lightweight and easy to use visualization client for viewing 1D data files. It includes features for animation, zooming and saving to postscript. (Also see the page for ygraph.)
Using xgraph
xgraph can be used to view 1D data files with the format
"Time=0.0
0.0  0.0
0.2  0.04
0.4  0.16
0.6  0.36
0.8  0.64
1.0  1.0

"Time=1.0
0.0  0.0
0.2 -0.04
0.4 -0.16
0.6 -0.36
0.8 -0.64
1.0 -1.0
Viewing a file is as easy as typing
xgraph <data filename>
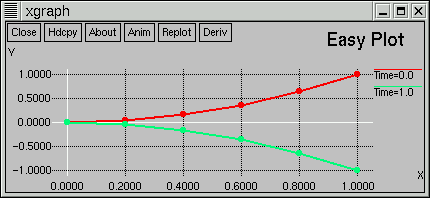
The are many options for customising aspects of and using xgraph (for example an animation option), type xgraph -help to see them. The image at the top of the page was created from the above data using
xgraph xgraph.dat -lw 2 -P -t "Easy Plot"
If you are using thorn CactusConnect/HTTPD you can setup your browser to automatically view any advertised xgraph files. Instructions on how to do this are provided in the WebServer-HOWTO.
Downloading xgraph
Binaries
Statically linked executables for some platforms are available
Source Code from SVN Repository
Checking out from the Cactus SVN repository allows you to easily update your code to obtain bug fixes or enhancements or to contribute back to us your own improvements. If you choose this option, you may wish to get update messages for any commits to the repository; if so, please contact us. To checkout from the repository, issue from a terminal:</p>
svn checkout https://svn.cactuscode.org/VizTools/xgraph
Support
Please direct questions about xgraph to cactusmaint@cactuscode.org

