
pyGraph
pyGraph: Animated, Easy Client for 1D Line Plots
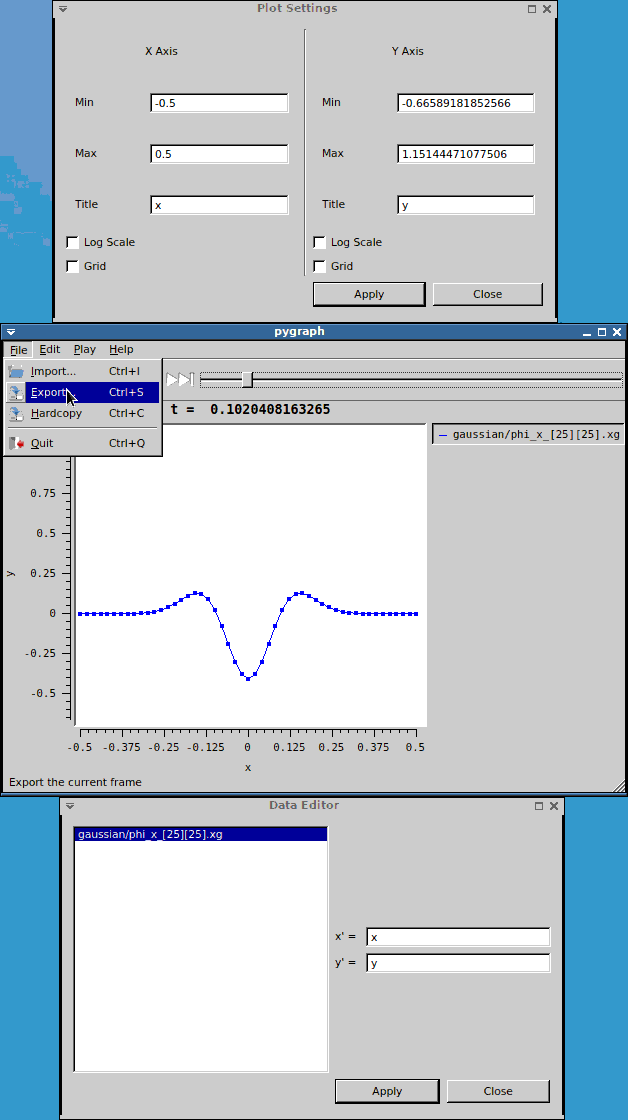
pyGraph is a freely available, lightweight and easy to use visualization client for viewing 1D data files which started out as a python re-implementation of yGraph.. It includes features for animation, zooming and saving to png. (Also see the page for ygraph.)
pyGraph was developed by David Radice. The source code can be obtained from the Mercurial repository https://bitbucket.org/dradice/pygraph/. pyGraph relies on https://bitbucket.org/dradice/scidata/ to read in Cactus data files.
Using pyGraph
pyGraph can be used to view one or multiple 1D data files with the format
"Time=0.0
0.0  0.0
0.2  0.04
0.4  0.16
0.6  0.36
0.8  0.64
1.0  1.0

"Time=1.0
0.0  0.0
0.2 -0.04
0.4 -0.16
0.6 -0.36
0.8 -0.64
1.0 -1.0
Such files can be created with the Cactus thorns CactusBase/IOASCII and CactusBase/IOBasic
Viewing files is as easy as typing
ygraph <data filename> <data filename>
The are several options for customising aspects of and using ygraph, a manpage can be built from the source, or type pygraph --help for more information.
If you are using thorn CactusConnect/HTTPD you can setup your browser to automatically view any advertised ygraph files. Instructions on how to do this are provided in the WebServer-HOWTO.
Getting Hold of pyGraph
Binaries and source code for ygraph are all available from the pyGraph mercurial repository.
Installation
pyGraph requires the following packages to be available
- PyQt-5, including its development tools for pyrcc4
- PythonQwt
which can be installed using your system’s package manager or via pip
pip install --user PyQt5
pip install --user pyqwt
Once those are installed pygraph and its scidata depency can be installed using pip
pip install --user git+https://bitbucket.org/dradice/scidata
pip install --user git+https://bitbucket.org/dradice/pygraph
Support
Please direct questions about pyGraph to its bitbucket ticket page https://bitbucket.org/dradice/pygraph/issues